AI workloads are notoriously hard to observe. A training run touches a hundred subsystems on every iteration: GPU compute, NVLink, host PCIe, NIC, storage, controller firmware, power, cooling. When something is slow, the answer almost always lives across multiple layers — but the tools to see across layers don't exist.
Vision was built specifically for this. It correlates traces and metrics across the full AI stack — workload-level traces from your scheduler, system-level metrics from BMCs and host OS, device-level signal from PCIe and storage controllers, and substrate-level data from the Datafabrix PCIe Gen6 Thermal-Aware Smart Backplane.
The result: when a training run is slow, you can answer 'why' in one query — not five tools, not three teams, not a war room.
A training iteration is traceable from kernel launch through PCIe transfer through storage access through power draw. One trace ID, every layer.
Pre-built dashboards for AI workloads: throughput, latency, throttle events, error rates, energy per token. Tuned for the metrics that actually matter.
When metric A spikes, Vision automatically surfaces every other signal that correlates — across layers, across tenants, across time.
First-class OpenTelemetry support means Vision drops into your existing observability pipeline without disruption. Your existing tools keep working; Vision adds the AI-stack-specific layer.
Every metric Vision emits is also available via Prometheus. Your existing Grafana dashboards, alerts, and integrations keep working.
Every byte of resource consumption is attributable to a workload, a tenant, a service. The unit economics of every AI workload become measurable.
Three representative engagements that illustrate the kind of value Datafabrix Vision delivers in the field.
A 4-hour training iteration is now taking 4 hours 12 minutes. Sometimes. Not always. Engineering has no idea why.
Vision's correlation engine surfaces that the 5% iterations align with a specific tenant's bursty checkpoint-write pattern saturating a shared NVMe channel. The training tenant and the checkpoint tenant are on the same rack.
Re-pack the two tenants. p95 iteration time stabilises. The training team gets the answer in one query.
Sustainability team wants per-token energy attribution for the company's largest LLM inference service. CFO wants per-token cost for the same.
Vision aggregates power draw, cooling cost (via Thermal module), and compute time per inference request. Output: a verifiable per-token energy and per-token cost figure.
Sustainability report has its numbers. CFO has a pricing-margin model. Both teams have a single source of truth.
An NVLink-aware all-reduce is performing 18% below expected. The team's been on it for a week. Three different tools each say 'looks fine to me'.
Vision's trace shows the all-reduce stalls on a specific PCIe path during a specific phase. Substrate-level signal confirms a marginal connector on one slot. The connector is reseated.
All-reduce returns to spec. One trace, one root cause, one hour of debugging instead of one week.
A live look at the dashboards, workflows, and telemetry surfaces you get with Vision.
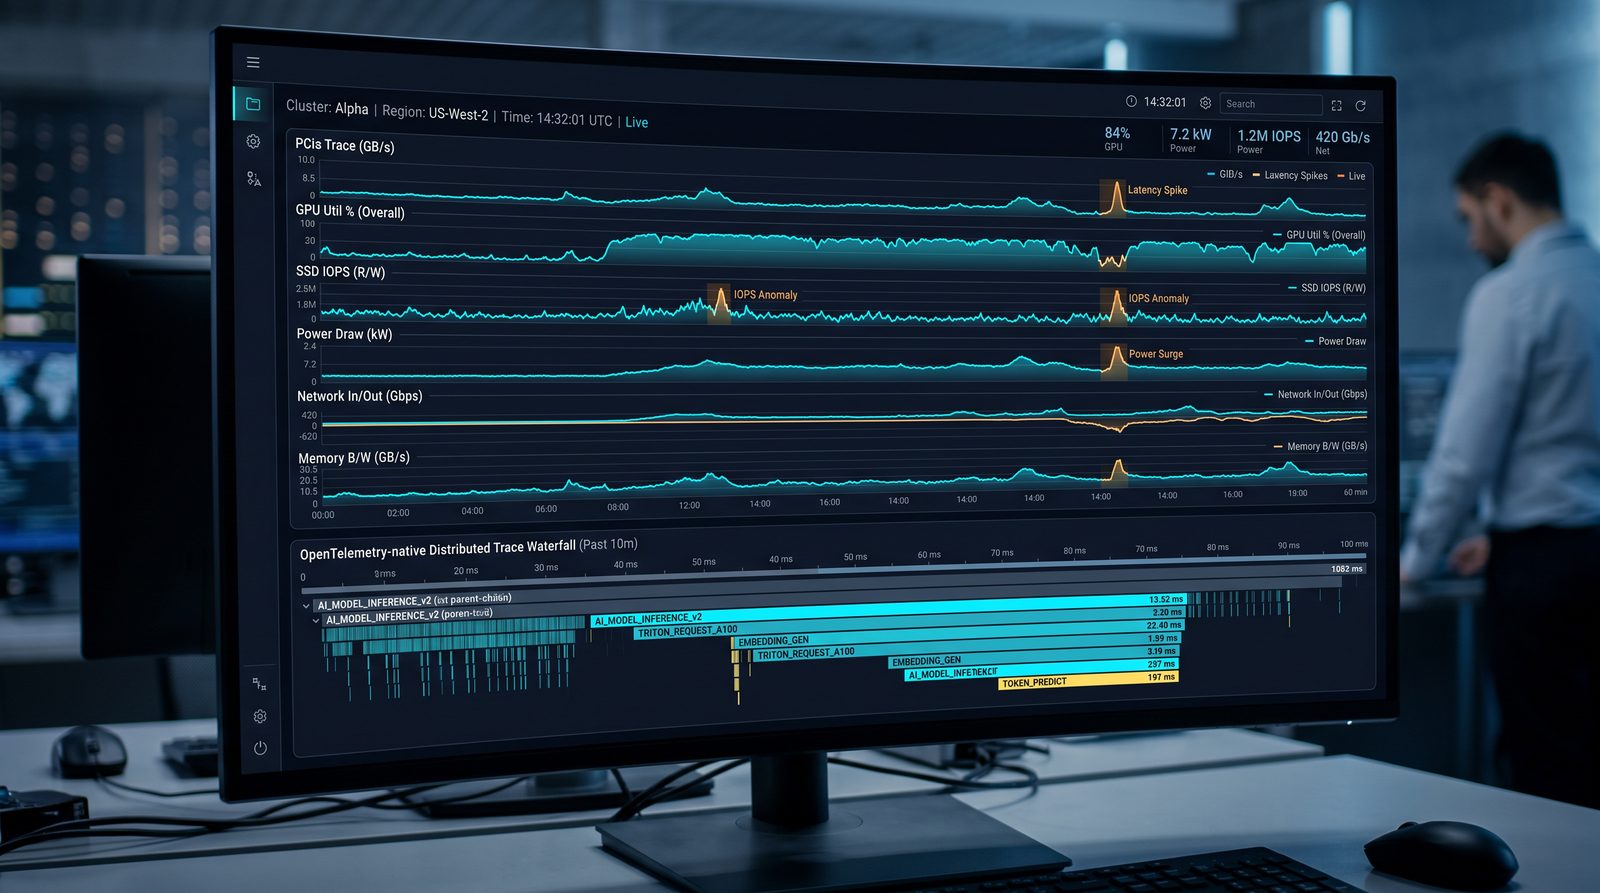
DF-P7 · Live DashboardOne trace layer across every accelerator, backplane, and drive. No stitching required.
First-class OTLP support — plugs into your existing observability stack (Grafana, Jaeger, Datadog).
Trace spans specifically for AI workloads — training-step, checkpoint, gradient-sync events.
Time-series waveforms for PCIe traffic, GPU utilization, IOPS, power — with anomaly overlays.
Correlates anomalies across layers to surface causal chains, not just symptom lists.
From hardware sensors up through the AI application — one trace, one view.
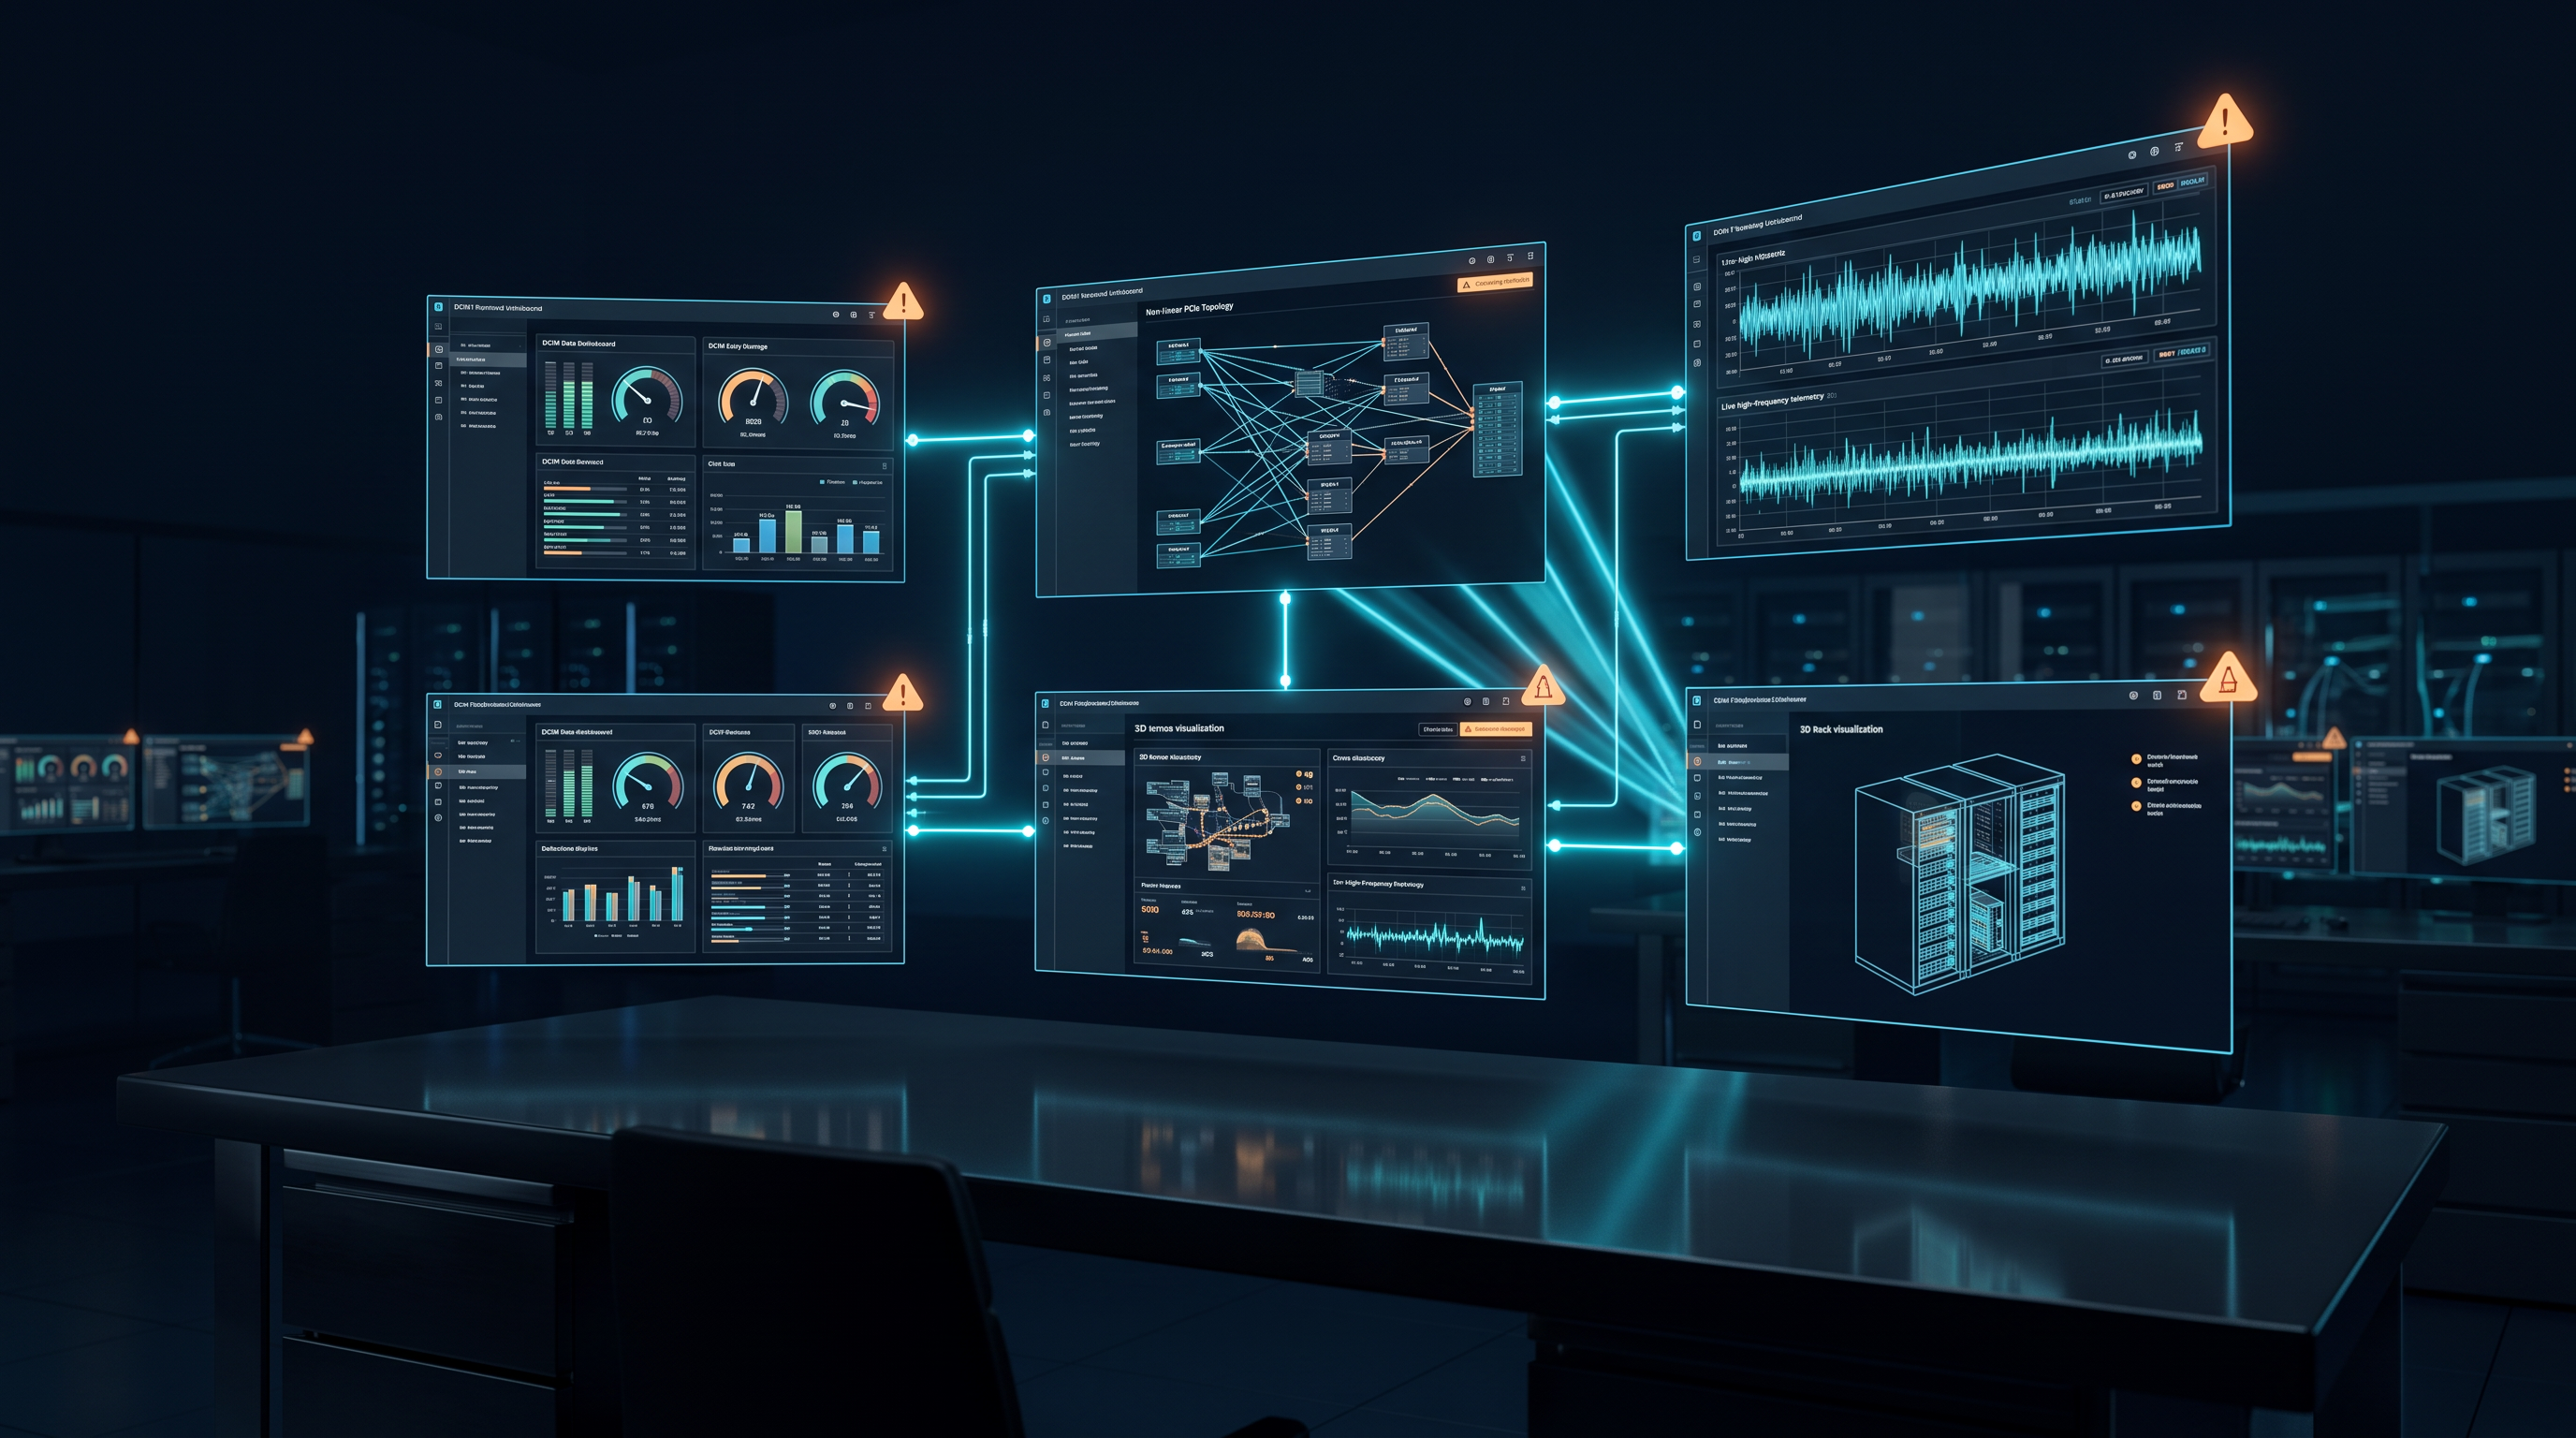
Tell us about your fleet and your top operational pain. We will map Datafabrix Vision to a 90-day pilot scope — and quantify the expected outcome — within five business days.