DATAFABRIX INSIGHT · MODULE
AI Analytics — engineered for AI-class workloads.
Domain-aware ML. Fleet-wide baselining. Drift detection that catches what classical monitoring misses.
Datafabrix Insight is the analytics module of the Datafabrix platform. It transforms raw fleet telemetry into the kind of operational intelligence your engineering, capacity-planning, and finance teams can actually act on — through domain-aware ML, not generic time-series.
Domain-aware ML. Fleet-wide baselining. Drift detection that catches what classical monitoring misses.
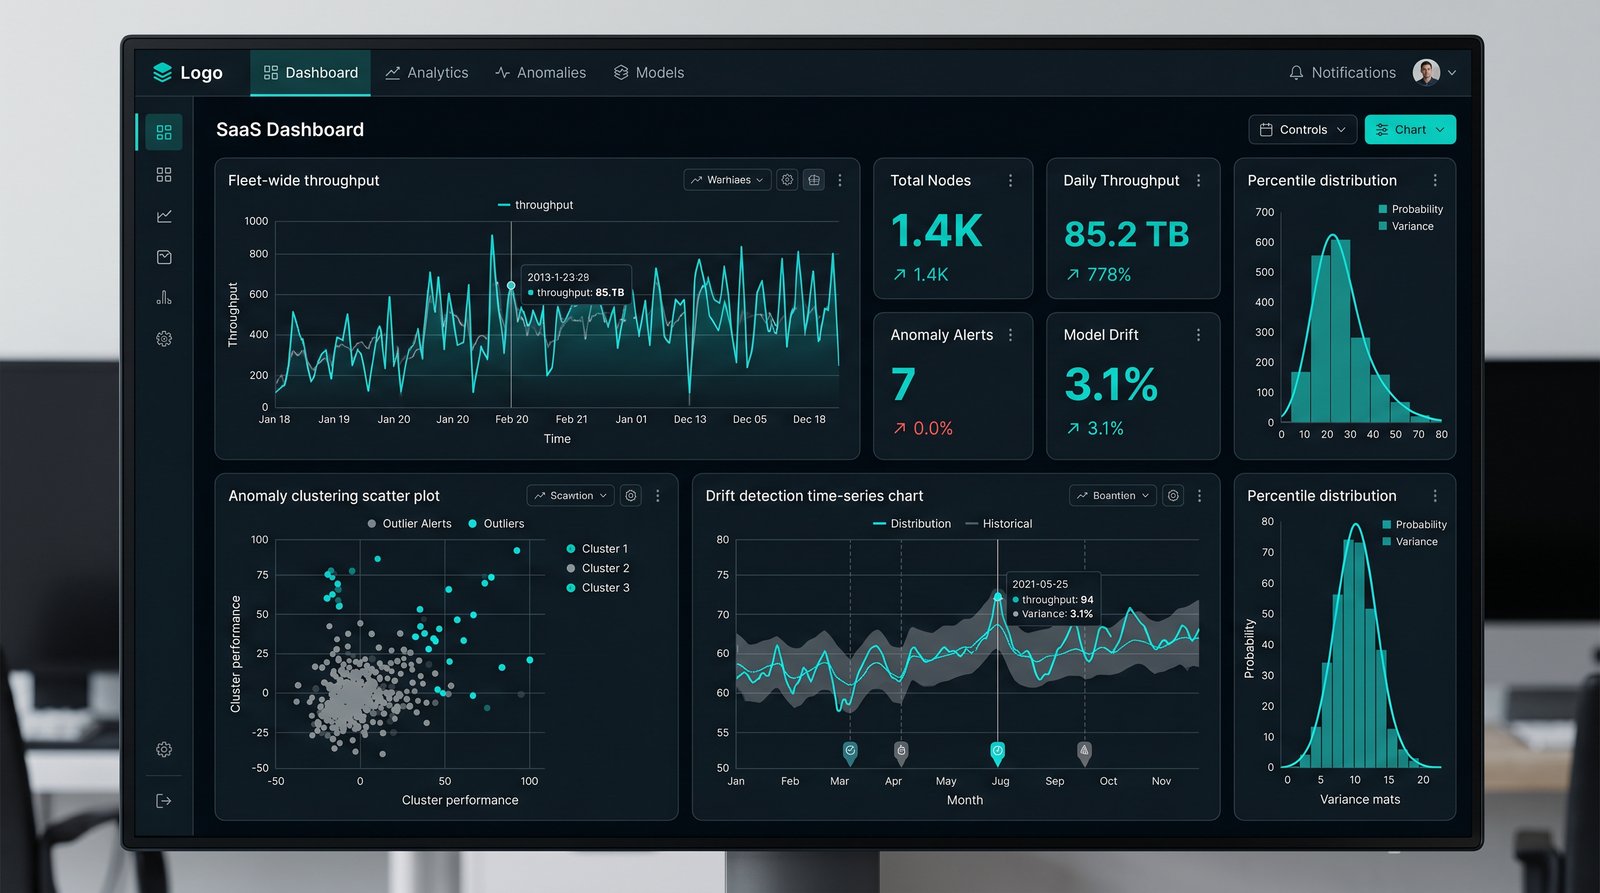
Every modern AI fleet drowns in metrics. Counters, traces, logs, sensor readings — millions of data points per second from thousands of devices. The hard part isn't collecting the signal. The hard part is making sense of it.
Standard observability tools were built for general-purpose IT. They have no concept of the difference between a substrate-level controller drift and a tenant workload spike. They don't know which kernel is hot-pathing through which lane on which board. They can't tell a noisy neighbour from a failing SSD.
Insight does. It is trained on the specific signal that AI infrastructure generates — and it speaks the language your engineers actually use: 'why is tenant X slow on rack 17?' and 'what changed in the last 30 minutes?' get answered in seconds, not war rooms.
Every device, every workload, every tenant has its own learned baseline. Insight knows what 'normal' looks like for your fleet and surfaces deviation in context.
Outliers don't just get flagged — they get grouped. Insight clusters thousands of related anomalies into a handful of meaningful incidents, drastically reducing alert fatigue.
Slow, subtle performance regressions that classical monitoring misses entirely are surfaced as drift signatures — often weeks before they would have caused customer-visible impact.
Down to the lane, the slot, the kernel. When throughput drops 7%, Insight tells you exactly which 14 devices contributed — and which workloads they were running.
Every customer fleet is automatically benchmarked against fleet-wide percentiles. Your team sees how you compare to best-in-class — and where your specific tuning opportunities live.
Three representative engagements that illustrate the kind of value Datafabrix Insight delivers in the field.
Inference latency p99 has crept up 7% over the last 14 days. Engineers can't reproduce it on demand. Classical monitoring shows green across the board.
Insight's drift detector identifies a slow PCIe link-quality degradation correlated with a thermal pattern on 4 specific cards. The pattern is sub-threshold on any single metric but unmistakable as a cluster.
Engineers replace the 4 cards in the next maintenance window. p99 returns to baseline. Two days of war-room time saved.
Finance wants to know: do we need to buy another 200 GPUs in Q3? Engineering's gut says yes. CFO wants data.
Insight runs a six-month performance attribution and surfaces that 18% of current utilisation is non-productive due to workload-fragmentation patterns. A re-pack of three tenants would reclaim the equivalent of 80 GPUs.
Capex deferred. Re-pack scheduled. Both Finance and Engineering get the answer the data supports.
Tenant A complains their job is slow. Tenant B is on the same rack and looks fine. Standard quotas are not violated.
Insight attributes Tenant A's latency to PCIe contention from Tenant B's bursty memory access pattern — a contention pattern that doesn't show up in any single counter but is obvious in the correlation engine.
Tenant B's workload is re-scheduled to a less-contested zone. Tenant A is whole. Both customers happy.
Tell us about your fleet and your top operational pain. We will map Datafabrix Insight to a 90-day pilot scope — and quantify the expected outcome — within five business days.